About This Report
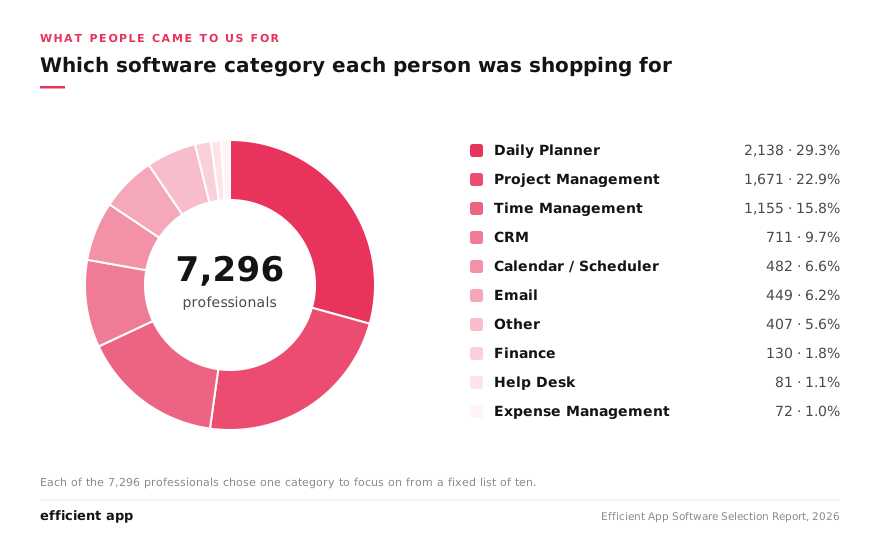
About This ReportBetween April 2024 and May 2026, 7,296 professionals came to Efficient App looking for help choosing business software. We asked them about their business, what software category they were shopping for, and what they were already using.
Key Findings
Key Findings- AI ranked last of four goals. Asked what was most important for their business, 7,296 professionals chose boosting productivity (65.0%), maximizing efficiency (59.2%) and automating work (44.1%) ahead of leveraging AI (38.7%). Only 5% wanted AI without also wanting something else.
- Project management: 80.2% of 1,630 people shopping for project management software said their top priority was a tool they could set up quickly and couldn't get wrong. Just 3.1% wanted advanced features.
- Daily planners: among 2,102 people shopping for a daily planner, 64.0% didn't use any planning tool at all. And only 10.3% said they enjoy planning their day. Most want a planner to help them focus, not because they like the ritual.
- Time management: 75.9% of 1,126 people shopping for time management software have fewer than five meetings a week. They aren't overwhelmed by their calendars. 86.2% said what they want is to always know the most important thing to work on next.
- Email: the most common thing 429 email shoppers wanted wasn't a feature at all. 44.5% just wanted to be told the best tool available, ahead of simplicity (31.2%), AI writing help (14.9%) and team collaboration (9.3%).
- CRM: 72.9% of 683 CRM shoppers said they were choosing a system to keep for years rather than dipping their toes in. But 31.7% had never used a CRM before.
- Help desk: among 70 small businesses shopping for customer support software, 55.7% handle support mainly by email. The other 44.3% now do it mainly through social media DMs, text or WhatsApp.
- Expense management: asked what matters most in an expense tool, 65.2% of 66 businesses chose integrations with their accounting software and 30.3% chose the best cash back rate. They could pick both, so this wasn't a trade-off. They just cared about rewards less.
Business Goals
Business GoalsEfficient App's 2026 Software Selection Report surveyed 7,296 professionals shopping for business software between April 2024 and May 2026. Before recommending anything, every respondent was asked what was most important for their business right now.
Core Findings
Core Findings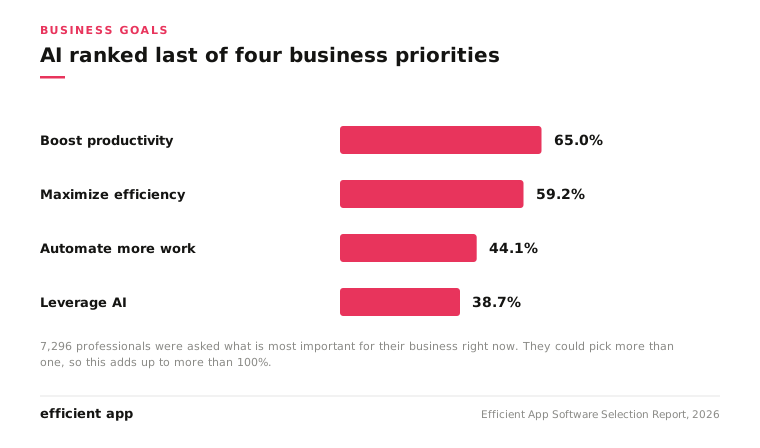
- AI ranked last of four goals. 38.7% selected leveraging AI, behind boosting productivity at 65.0%, maximizing efficiency at 59.2% and automating work at 44.1%. Respondents could select more than one.
- Almost nobody wants AI on its own. Just 5.0%, or 364 respondents, chose AI without also selecting another goal. Of the 2,823 who wanted AI, 62% also wanted productivity.
- Every other goal shifts with team size. AI doesn't. Wanting to boost productivity falls from 68.8% among people working alone to 57.9% among those with teams. Automating work rises from 40.5% to 51.1%. Leveraging AI sits at 38.7% in both groups.
- Industry barely moves it either. Agencies and tech startups were most interested in AI, at 43.4% and 43.2%. Service businesses were least interested at 35.5%. That's a spread of under eight points.
What is most important for their business right now? Efficient App asked all 7,296 respondents. Multiple answers were allowed, so shares do not total 100%. Respondents chose 2.07 goals on average.
Answer | Share | Respondents |
|---|---|---|
Boost Productivity: Supercharge your output and get things done faster | 65.0% | 4,744 |
Maximize Efficiency: Streamline processes and optimize overall performance | 59.2% | 4,316 |
Automate More Work: Reduce manual tasks and increase automation | 44.1% | 3,221 |
Leverage AI: Integrate advanced AI tools to gain insights and improve decision-making | 38.7% | 2,823 |
Working alone changes every goal except AI
Works alone | Has a team | |
|---|---|---|
Boost productivity | 68.8% | 57.9% |
Maximize efficiency | 57.5% | 62.3% |
Automate more work | 40.5% | 51.1% |
Leverage AI | 38.7% | 38.7% |
Respondents | 4,779 | 2,517 |
Solo operators want to get more done. Teams want to streamline and automate, which makes sense when work has to move between people. AI is the exception, and it is a strange one: identical to the first decimal place across two groups that differ on everything else.
Takeaway
TakeawayAI is not what these buyers are shopping for. It is not that they reject it, since 38.7% is a substantial minority and only 5% wanted it in isolation. It is that AI is a means rather than an end. What people are actually trying to buy is output, and AI is one possible route to it, ranked below three more direct ones.
Project Management
Project ManagementEfficient App's 2026 Software Selection Report surveyed 7,296 professionals shopping for business software between April 2024 and May 2026. Project management was the second most requested category, chosen by 1,671 respondents. Here is what they said they wanted.
Core Findings
Core Findings80% of project management software buyers prioritize simplicity over customization or PMO-level features.
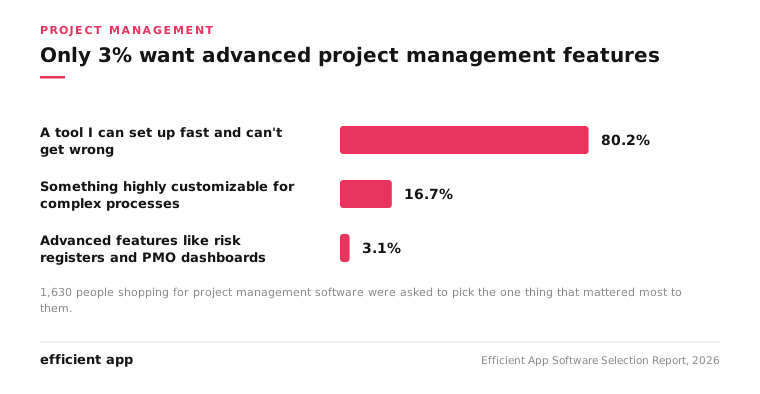
- Four in five want the simple version. In Efficient App's survey of 1,630 people shopping for project management software, 80.2% said their top priority was a tool they could set up quickly and could not easily misuse.
- Almost nobody wants the advanced features. Just 3.1%, or 50 of those 1,630 respondents, chose the option built around PMO-level capabilities such as risk registers, RACI charts and advanced dashboards. A further 16.7% wanted extensive customisation for complex processes.
- Even experts want simple. Among the 208 respondents who described themselves as expert users, the group least likely to choose the simplest option, 57.7% still prioritised ease of setup. Among the 531 who had never used project management software, it was 88.9%.
- Experience predicts this; company size and industry barely do. Efficient App tested all three. Experience produced a 31-point swing. Industry moved the result by 11 points, and company size showed no significant effect once experience was accounted for.
Most Important Features
Most Important FeaturesWhat is most important to you in a project management tool? Efficient App asked 1,630 people shopping for project management software.
Share | Respondents | |
|---|---|---|
Easiest Setup & Team Training. I want a tool that I can set up relatively quickly, and that I can't really mess up in terms of how I use it with my team. | 80.2% | 1,307 |
Custom. I want something highly customizable because my processes are complex. I plan on hiring a consultant to help me with configuration and am okay spending 100+ hours to map our processes to the tool. | 16.7% | 273 |
Robust. I need to create things like risk registers, RACI charts, retro logs, submittal/RFI/ASI logs, or PMO-Level dashboards. I plan to hire a consultant to help me with set up and team training. | 3.1% | 50 |
Experience
ExperienceHow much experience do you have with project management tools? Efficient App asked 1,628 people shopping for project management software.
Share | Respondents | |
|---|---|---|
A little 🤏 | 53.9% | 878 |
None ❌ | 33% | 538 |
I'm an expert 🦾 | 13% | 212 |
Combining the data: Among the 1,595 people who answered both questions, the majority of professionals want the simplest project management tool, despite their level of expertise with the tool. Even experts desire the most simple tool.
Experience with PM tools | Wanted the simplest tool |
|---|---|
None (531 people) | 88.9% |
A little (856 people) | 80.5% |
Expert (208 people) | 57.7% |
Industry
IndustryIndustry made less difference: Efficient App asked 1,186 respondents what type of business they run. The simple solution was overwhelmingly desired across all industries, although 20% of Tech and e-commerce startups skewed towards wanting something a bit more customizable.
Industry | Simplest | Custom | Robust | Respondents |
|---|---|---|---|---|
Service-based | 83.8% | 15.2% | 1.0% | 401 |
Agency / consultancy | 82.4% | 15.3% | 2.4% | 425 |
Manufacturing / B2B | 79.7% | 17.2% | 3.1% | 64 |
Real estate | 78.4% | 17.6% | 3.9% | 51 |
Tech startup | 73.2% | 20.5% | 6.3% | 190 |
Ecommerce | 72.7% | 20.0% | 7.3% | 55 |
Daily Planner
Daily PlannerEfficient App's 2026 Software Selection Report surveyed 7,296 professionals shopping for business software between April 2024 and May 2026. Daily planners were the most requested category, chosen by 2,138 respondents. Here is what they said they wanted.
Core findings
Core findings- Two thirds don't have a planner yet. In Efficient App's survey of 2,102 people shopping for a daily planner, 64% said they use no planning tool at all.
- Almost nobody enjoys planning. Just 10.3% said they enjoy planning their day. 58.6% want a planner to help them focus and get more work done (n = 2,087).
- Most still want a hand in planning. Asked how the planning should happen, 44.7% want software to plan their day automatically while 39.6% would rather spend 10 to 15 minutes doing it manually. Of those manual planners, only 16.6% are people who actually enjoy planning (n = 2,084).
- Team size changes what people want; industry doesn't. As teams grow, the reason for wanting a planner shifts from focus to consolidating tasks from multiple tools. Industry showed no meaningful relationship with any answer.
Current Use
Current UseEfficient App asked 2,102 people shopping for a daily planner whether they currently use one. 2,102 answered.
Answer | Share | Respondents |
|---|---|---|
No | 64.0% | 1,345 |
Yes | 36.0% | 757 |
Purpose of Wanting Daily Planner
Purpose of Wanting Daily Planner.svg)
Why do you want a daily planner? 2,087 answered.
Answer | Share | Respondents |
|---|---|---|
Focus & get more work done | 58.6% | 1,224 |
Have all my tasks from different software in one tool | 31.1% | 649 |
I enjoy planning my day | 10.3% | 214 |
Automated vs Self-Planning
Automated vs Self-PlanningHow much of the planning do you want to do yourself? 2,084 answered.
Answer | Share | Respondents |
|---|---|---|
The Assistant. A tool that automatically plans my day for me, and adapts automatically as my schedule changes | 44.7% | 932 |
Intentional Planning. Manually spending 10-15 minutes each day planning my tasks for the week with a cup of tea | 39.6% | 826 |
Task Consolidation. I just want all my emails, Slack messages and tasks from my project management tools in one place | 15.6% | 326 |
Solo vs Team
Solo vs TeamWorking alone changes what people want from a planner
Efficient App split respondents by team size. All three questions showed significant differences at p < 0.0001.
Works alone | Has a team | |
|---|---|---|
Uses no planner today | 65.9% | 54.4% |
Wants it to focus and get more done | 60.3% | 50.3% |
Wants it to consolidate tasks in one place | 28.8% | 42.4% |
Wants to plan manually | 41.5% | 30.6% |
Wants software to plan automatically | 44.1% | 47.6% |
Respondents | 1,735 | 355 |
Takeaway
TakeawayThe job of a daily planner changes as soon as someone works with other people. Alone, it's about directing your attention. With colleagues, it's about gathering up work that's scattered across more tools than one person can track.
That's also why the appetite for planning your own day drops by roughly a quarter once there's a team involved. The near-even split between manual and automatic planning is mostly a solo phenomenon. Among people with colleagues, 47.6% want software to plan for them against 30.6% who want to do it themselves.
CRM
CRMEfficient App's 2026 Software Selection Report surveyed 7,296 professionals shopping for business software between April 2024 and May 2026. CRM was chosen by 711 respondents. Here is what they said they wanted.
Core Findings
Core FindingsCRM buyers are the most committed group in the study, but a third have never used one.
- Nearly three quarters are buying for the long term. In Efficient App's survey of 683 people shopping for a CRM, 72.9% said they wanted to make the right choice long-term rather than test whether a CRM suited them short-term.
- Most want it for relationships, not process. Among 686 respondents, 57.0% wanted a CRM to manage contacts and relationships, 25.5% to manage business processes across their team, and 17.5% for integrations with other software.
- A third are complete beginners. Of 694 respondents, 31.7% had never used a CRM and only 14.4% considered themselves experts.
- This is a Google Workspace market. 60.9% of 680 respondents run their business on Google Workspace, against 18.7% on Microsoft 365.
How committed are you to adopting a CRM? Efficient App asked 683 people shopping for a CRM.
Answer | Share | Respondents |
|---|---|---|
I'm committed. I want to make the right choice long-term. I'm looking to set up a CRM that will be the foundation to my business for years to come. | 72.9% | 498 |
Not sure. I'm planning on trying a CRM to see if it's something I want to use and introduce to my team. | 27.1% | 185 |
Main Reason Why They Want a CRM
Main Reason Why They Want a CRM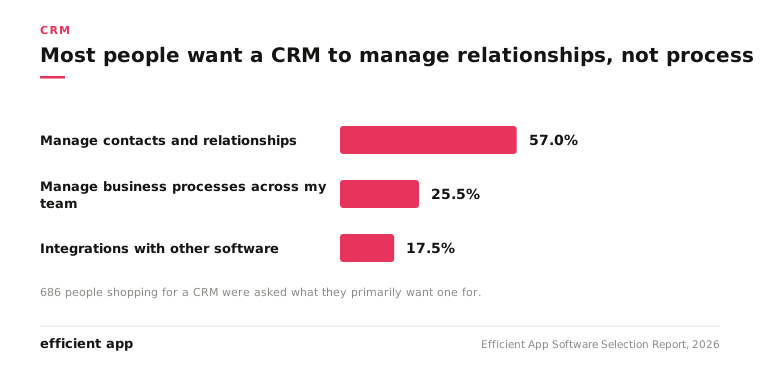
What do you primarily want a CRM for? Efficient App asked 686 people shopping for a CRM.
Answer | Share | Respondents |
|---|---|---|
Manage contacts & relationships | 57.0% | 391 |
Manage business processes across my team | 25.5% | 175 |
Integrations with other software | 17.5% | 120 |
Google Workspace vs Microsoft 365
Google Workspace vs Microsoft 365What does your business run on? Efficient App asked 680 people shopping for a CRM.
Answer | Share | Respondents |
|---|---|---|
Google Workspace | 60.9% | 414 |
Microsoft 365 | 18.7% | 127 |
Other | 20.4% | 139 |
CRM Experience
CRM ExperienceHow much experience do you have with CRMs? Efficient App asked 694 people shopping for a CRM.
Answer | Share | Respondents |
|---|---|---|
A little | 53.9% | 374 |
None | 31.7% | 220 |
I'm an expert | 14.4% | 100 |
Solo vs Team
Solo vs TeamWorks alone | Has a team | |
|---|---|---|
Wants it to manage contacts and relationships | 64.5% | 52.4% |
Wants it to manage business processes | 12.6% | 33.5% |
Wants it for integrations | 22.9% | 14.2% |
Respondents | 262 | 424 |
Difference significant at p < 0.0001.
Wanting a CRM to run business processes is nearly three times more common among people with colleagues, jumping from 12.6% to 33.5%. Solo respondents want an address book that connects to things. Teams want a system of record.
Worth noting that CRM is the one category where solo operators are a minority. They make up 65% of the study overall but only 38% of CRM shoppers.
CRM Experience Predicts Commitment
CRM Experience Predicts CommitmentExperience with CRMs | Committed to a long-term choice |
|---|---|
None (214 people) | 61.2% |
A little (364 people) | 78.0% |
Expert (96 people) | 82.3% |
Difference significant at p < 0.0001.
People who have used a CRM before arrive ready to commit. Beginners are far more likely to be testing the idea, with almost four in ten saying they were just trying it out.
Industry made no difference
Efficient App tested whether industry predicted either what people wanted a CRM for or how committed they were. Neither showed a meaningful relationship (p = 0.69 and p = 0.09).
Takeaway
TakeawayTwo different things shape this market, and neither is industry. Team size determines what the CRM is for, shifting from managing relationships to running processes. Experience determines how seriously someone arrives, with beginners far more likely to be experimenting than committing.
Email Client
Email ClientEfficient App's 2026 Software Selection Report surveyed 7,296 professionals shopping for business software between April 2024 and May 2026. Email was chosen by 449 respondents. Here is what they said they wanted.
Core finding: email is the most personal software category in the study. 72% want it better for themselves, not their team. Among people working alone, that rises to 90.5%.
- They're buying for themselves. In Efficient App's survey of 432 people shopping for an email tool, 72.0% wanted a tool that makes email better for them personally. Only 13.2% wanted it better for their whole team.
- Most people just want to be told what to use. Among 429 respondents, 44.5% said their top priority was simply being told the best tool available, ahead of any specific capability.
- AI came third of four. 14.9% wanted AI features to help write their emails, behind wanting something simple, minimal and fast at 31.2%.
- A fifth of the inbox is junk. 22.2% of 410 respondents said junk made up the biggest share of their inbox, second only to emails needing a personal reply at 50.7%.
Purpose For Shopping For Email Client
Purpose For Shopping For Email ClientWhat do you want a new email tool to do? Efficient App asked 432 people shopping for an email tool.
Answer | Share | Respondents |
|---|---|---|
Makes email better for me | 72.0% | 311 |
Helps my team respond to customer support and sales requests more efficiently | 14.8% | 64 |
Makes email better for my entire team | 13.2% | 57 |
Main Inbox Problems
Main Inbox ProblemsWhat makes up the biggest share of your inbox? Efficient App asked 410 people shopping for an email tool.
Answer | Share | Respondents |
|---|---|---|
Emails that I need to respond to 1:1 | 50.7% | 208 |
Pure junk | 22.2% | 91 |
Sales or support emails from my customers | 16.3% | 67 |
Emails from my team | 10.7% | 44 |
What Matters Most
What Matters Most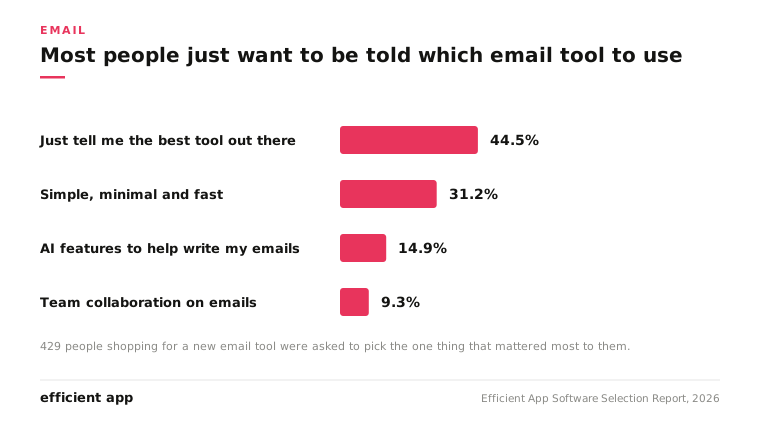
What matters most in an email tool? Efficient App asked 429 people shopping for an email tool.
Answer | Share | Respondents |
|---|---|---|
The Best. I just want the best tool out there to solve my email problems. Tell me already! | 44.5% | 191 |
Simple, minimal, fast, and easy to use | 31.2% | 134 |
AI Features. I want AI to help me write my emails | 14.9% | 64 |
Team Collaboration. I want to collaborate with team members on emails so that anyone can jump in and answer emails | 9.3% | 40 |
Current Email Provider
Current Email ProviderWhich email provider do you use? Efficient App asked 406 people shopping for an email tool. 343 chose between the two options offered; 63 wrote in another provider, most commonly Apple Mail, Spark and Zoho.
Answer | Share of the 343 | Respondents |
|---|---|---|
Gmail | 70.6% | 242 |
Outlook | 29.4% | 101 |
Solo vs Team
Solo vs TeamWorking alone changes email more than any other category
Works alone | Has a team | |
|---|---|---|
Wants email better for themselves | 90.5% | 42.9% |
Wants email better for their team | 2.7% | 29.8% |
Says junk is the biggest part of their inbox | 31.0% | 7.7% |
Says customer sales and support is the biggest part | 10.2% | 26.5% |
Wants something simple, minimal and fast | 38.4% | 19.9% |
Wants team collaboration features | 3.0% | 19.3% |
Respondents | 260 | 165 |
All three questions differ significantly at p < 0.0001.
At 90.5%, "make email better for me" is the most lopsided answer anywhere in this study. Among solo respondents, wanting email to work better for a team drew 2.7%, which is seven people.
The inbox composition finding is interesting. Solo respondents said junk was the single biggest category in their inbox four times more often than people with colleagues, 31.0% against 7.7%. That is probably less about receiving more junk and more about receiving less of everything else. When there is no internal team email and fewer customer threads, what remains is noise.
Industry showed no reliable pattern. What people prioritised in a tool had no meaningful relationship with industry at all (p = 0.45), and the other two questions produced marginal results driven by groups as small as 13 people.
Takeaway
TakeawayEmail is bought by individuals for themselves. Team collaboration features, which most business email products lead with, were the lowest priority overall and were chosen by 3.0% of people working alone. Meanwhile the most popular answer of all was "just tell me what to use," which suggests this is a category where buyers are tired rather than demanding.
Time Management
Time ManagementEfficient App's 2026 Software Selection Report surveyed 7,296 professionals shopping for business software between April 2024 and May 2026. Time management was chosen by 1,155 respondents. Here is what they said they wanted.
Core Findings
Core FindingsThe productivity industry sells meeting relief. Three quarters of these buyers have fewer than five meetings a week.
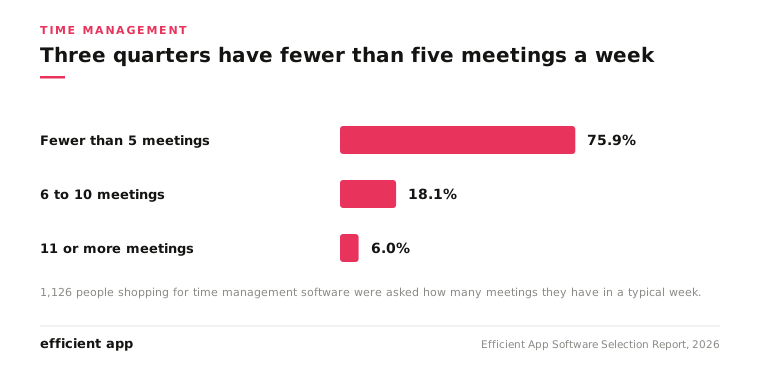
- Nobody is drowning in meetings. In Efficient App's survey of 1,126 people shopping for time management software, 75.9% reported fewer than five meetings per week. Only 6.0% had eleven or more.
- What they want is clarity, not scheduling. Among 1,134 respondents, 86.2% said they wanted to always know the most important task to work on next. Just 3.8% wanted an assistant to schedule team meetings.
- Even protecting focus time is a minority concern. 10.0% said colleagues were constantly booking their calendar and they wanted it blocked automatically.
- Google owns the calendar. 55.3% of 1,128 respondents use Google Calendar, against 19.7% on Outlook and 15.1% on Apple.
What Matters Most
What Matters MostWhat do you want most from a time management tool? Efficient App asked 1,134 people shopping for time management software.
Answer | Share | Respondents |
|---|---|---|
Focus/Organization. I want to always know the most important task to work on next, where my team needs me, and get work done more efficiently. | 86.2% | 978 |
Focus Time. My co-workers are constantly scheduling meetings on my calendar, I want to automatically block off my calendar so I have focus time or even time for lunch! | 10.0% | 113 |
Automatically Schedule Team Meetings. I want an assistant to find the best times for me and my team to meet because we have a lot of meetings per week. | 3.8% | 43 |
Meetings Per Week
Meetings Per WeekHow many meetings do you have per week? Efficient App asked 1,126 people shopping for time management software.
Answer | Share | Respondents |
|---|---|---|
Less than 5 | 75.9% | 855 |
6-10 | 18.1% | 204 |
11 or more | 6.0% | 67 |
Current Calendar
Current CalendarWhich calendar do you use? Efficient App asked 1,128 people shopping for time management software.
Answer | Share | Respondents |
|---|---|---|
Google Calendar | 55.3% | 624 |
Outlook | 19.7% | 222 |
Apple | 15.1% | 170 |
Other | 9.9% | 112 |
Meeting Trends
Meeting TrendsMeeting load rises with team size, but what people want doesn't
Works alone | Has a team | |
|---|---|---|
Fewer than 5 meetings a week | 79.2% | 64.7% |
6 to 10 meetings a week | 15.4% | 27.4% |
11 or more meetings a week | 5.4% | 7.9% |
Wants focus and organization | 87.2% | 82.8% |
Wants help scheduling meetings | 3.3% | 5.6% |
Respondents | 880 | 251 |
Meeting load differs significantly at p < 0.0001. What people want does not (p = 0.13).
This is the interesting part. People with colleagues genuinely do have more meetings, but it doesn't change what they want from software. Even among people with teams, 82.8% want help knowing what to work on, and only 5.6% want help scheduling.
Industry followed the same pattern. Meeting load varied, with tech startups and manufacturing reporting the heaviest calendars, but what people wanted from a tool showed no meaningful relationship with industry at all (p = 0.59).
Takeaway
TakeawayMore meetings do not create demand for meeting software. The number of meetings someone has changes with their team size and their industry. What they want software to do stays fixed at roughly six in seven wanting help with focus. These buyers are not overwhelmed by their calendars. They are unsure what to work on.
Help Desk
Help DeskEfficient App's 2026 Software Selection Report surveyed 7,296 professionals shopping for business software between April 2024 and May 2026. Help desk was chosen by 81 respondents, making it one of the smallest categories in the study. Sample sizes are shown alongside every figure below.
Core Findings
Core Findings44% of small businesses shopping for help desk software handle support primarily through social DMs or messaging apps, not email.
- Email is still the default, but only just. In Efficient App's survey of 70 businesses shopping for help desk software, 55.7% said email was their primary support channel. 25.7% said social media DMs and 18.6% said text messages or WhatsApp.
- Most are handling modest volume. 77.8% of 72 respondents handle fewer than 5,000 support tickets a month.
- Quality and stability matter about equally. Asked what mattered most, 40.8% of 71 respondents chose giving customers the best possible service and 38.0% chose a tool stable enough to handle high ticket volume.
- This is the least solo category in the study. Only 27.2% of help desk respondents worked alone, against 65.5% across the full survey.
Primary Support Channel
Primary Support Channel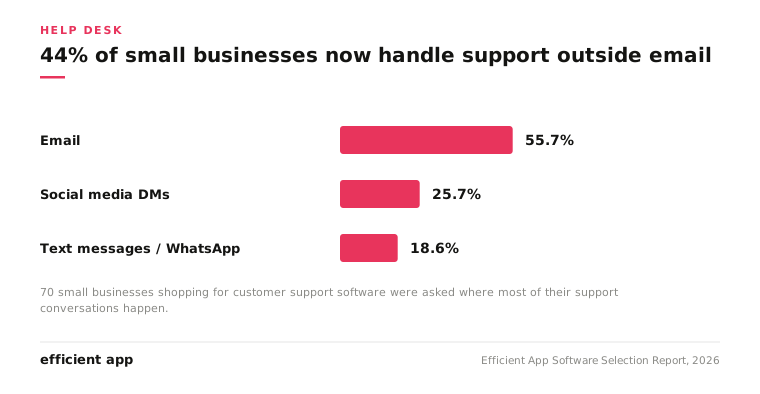
What is your primary support channel? Efficient App asked 70 businesses shopping for help desk software.
Answer | Share | Respondents |
|---|---|---|
Emails (sales, support etc.) | 55.7% | 39 |
Social media DMs | 25.7% | 18 |
Text messages / WhatsApp | 18.6% | 13 |
Support Tickets Per Month
Support Tickets Per MonthHow many support tickets do you handle per month? Efficient App asked 72 businesses shopping for help desk software.
Answer | Share | Respondents |
|---|---|---|
Fewer than 5,000 | 77.8% | 56 |
5,000 to 20,000 | 9.7% | 7 |
21,000 or more | 12.5% | 9 |
What Matters Most
What Matters MostWhat matters most in a help desk tool? Efficient App asked 71 businesses shopping for help desk software.
Answer | Share | Respondents |
|---|---|---|
Giving my customers the best customer service | 40.8% | 29 |
A stable help desk that can handle a large volume of tickets | 38.0% | 27 |
Having one software to manage emails, SMS and social media messages in one place so my team can collaborate across channels | 21.1% | 15 |
Who is Buying Help Desk Software
Who is Buying Help Desk SoftwareHelp desk stood apart from every other category in the study on team size. Just 27.2% of respondents worked alone, compared with 65.5% of the full survey. Teams of 2 to 5 were the largest group at 38.3%, and 11.1% came from companies of 200 people or more, roughly ten times that group's share of the overall study.
Ticket volume was unusually split. Most respondents sit well under 5,000 a month, but a distinct minority of 12.5% handle more than 21,000, with almost nobody in between. Small operations and genuinely high-volume ones appear to be shopping for the same tools.
Efficient App did not break these results down by team size or industry. With 70 to 72 respondents per question, those cuts would produce groups of two to sixteen people, which is too small to report responsibly.
Takeaway
TakeawaySupport has already moved off email for a substantial minority of small businesses. Combined, social DMs and messaging apps are the primary support channel for 44.3% of respondents, close to email's 55.7%. Yet only 21.1% said their priority was a single tool that unifies those channels, which suggests the shift in where customers are talking has run ahead of the tooling businesses think they need.
Expense Management
Expense ManagementEfficient App's 2026 Software Selection Report surveyed 7,296 professionals shopping for business software between April 2024 and May 2026. Expense management was chosen by 72 respondents, the smallest category in the study. Sample sizes are shown alongside every figure below.
Core Findings
Core FindingsSmall businesses choosing expense software care about accounting integrations more than twice as much as cash back.
- Integration beats rewards. In Efficient App's survey of 66 businesses shopping for expense management software, 65.2% said integrations with accounting software mattered most, against 30.3% who chose the best cash back rate. Respondents could select as many options as applied, so this was not a forced trade-off.
- Visibility matters more than cards. 51.5% wanted a good interface for comparing what they spend, ahead of 33.3% who wanted easy virtual and employee cards.
- These are lean operations. 72.7% of respondents hold between $1,000 and $65,000 in their business bank account.
- A small high-balance minority exists. 15.2%, or 10 respondents, hold at least $1 million.
What Matters Most
What Matters MostWhat matters most in an expense management tool? Efficient App asked 66 businesses shopping for expense management software. Respondents could select as many options as applied, so shares do not total 100%. They chose 1.8 options each on average.
Answer | Share | Respondents |
|---|---|---|
Integrations with accounting software | 65.2% | 43 |
Great interface and features that will allow me to compare what I am spending on services and subscriptions | 51.5% | 34 |
Easy way to create virtual cards & employee cards | 33.3% | 22 |
Best cash back % | 30.3% | 20 |
Bank Account Balances
Bank Account Balances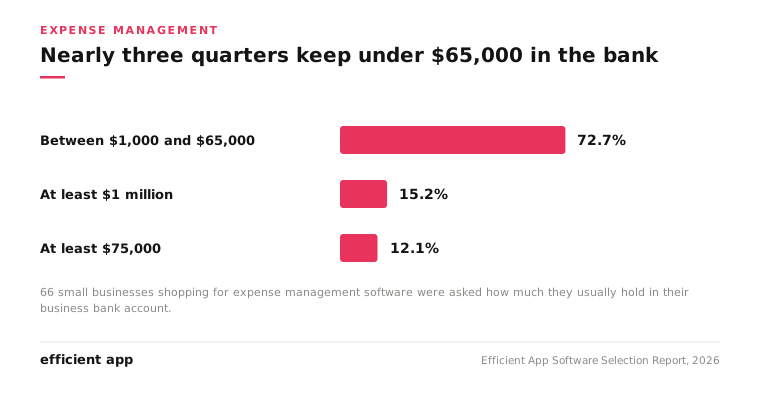
How much do you usually hold in your business bank account? Efficient App asked 66 businesses shopping for expense management software.
Answer | Share | Respondents |
|---|---|---|
Between $1,000 and $65,000 | 72.7% | 48 |
At least $1 million | 15.2% | 10 |
At least $75,000 | 12.1% | 8 |
Who is buying expense management software
Who is buying expense management softwareExpense management drew a mix. 37.5% of the 72 respondents worked alone, below the 65.5% solo rate across the full study, and 30.6% came from teams of 2 to 5. Service businesses and agencies made up the largest industry groups.
Efficient App did not break these results down by team size or industry. With 66 respondents, those cuts would produce groups of two to eighteen people, which is too small to report responsibly.
The relationship between balance and priorities is worth noting but not leaning on. Integration preference was highest among businesses holding $75,000 or less and lowest among the $1 million group, but that group is 10 people, so the difference is not reliable.
Takeaway: expense management products tend to lead their marketing with rewards, and this is not what small operators say they are shopping for. On a question where they could have picked everything, cash back finished last of four options. What they wanted was for the tool to slot into the accounting system they already run and to show them where the money is going. For a business holding under $65,000, a few points of cash back is worth less than not having to reconcile receipts by hand.
Calendar
CalendarEfficient App's 2026 Software Selection Report surveyed 7,296 professionals shopping for business software between April 2024 and May 2026. Calendar and scheduling tools were chosen by 482 respondents.
Core Findings
Core FindingsThis is the most solo-dominated category in the study, and nobody wanted a more powerful calendar. They wanted a nicer one.
- Three quarters work alone. 75.5% of calendar shoppers were solo operators, against 65.5% across the full study.
- The category splits almost evenly, and team size explains the whole split. 53.7% of 482 respondents wanted a basic calendar with better design, while 46.3% wanted a basic calendar plus a built-in meeting scheduler.
- Solo and team respondents want opposite things. Among people working alone, 59.1% wanted better design. Among those with colleagues, 62.7% wanted the scheduler.
- Google dominates. 58.1% already use Google Calendar. iPhone users made up 59.5% of the category.
What Matters Most
What Matters MostWhat do you want from a calendar tool? Efficient App asked 482 people shopping for a calendar or scheduling tool.
Answer | Share | Respondents |
|---|---|---|
A basic calendar with a better design/user experience (a level up from Google, Outlook or Apple Mail) | 53.7% | 259 |
A basic calendar + meeting scheduler. I might put in a few reminders/basic tasks onto my calendar, but this isn't a huge focus | 46.3% | 223 |
Current Calendar
Current CalendarWhich calendar do you use today? Efficient App asked 482 people shopping for a calendar or scheduling tool.
Answer | Share | Respondents |
|---|---|---|
Google Calendar | 58.1% | 280 |
Other | 17.2% | 83 |
Outlook Calendar | 13.5% | 65 |
Apple | 11.2% | 54 |
Devices
DevicesWhich device do you use? Efficient App asked 482 people shopping for a calendar or scheduling tool.
Answer | Share | Respondents |
|---|---|---|
iOS (iPhone) | 59.5% | 287 |
Android | 40.5% | 195 |
Solo vs Team
Solo vs TeamWorking alone changes what a calendar is for:
Works alone | Has a team | |
|---|---|---|
Wants a better-designed calendar | 59.1% | 37.3% |
Wants a built-in meeting scheduler | 40.9% | 62.7% |
Respondents | 364 | 118 |
Difference significant at p = 0.0001.
The even split at the category level is an artefact of averaging two groups that want different things. Someone working alone mostly wants their calendar to be pleasant to look at. Someone with colleagues wants to stop the back-and-forth of finding a time. Industry showed no meaningful relationship (p = 0.12).
Takeaway
TakeawayNeither group wanted more calendar. Both answer options describe a "basic calendar," and nobody in this category was shopping for a system that would take over their planning. Both groups already have a calendar that works, 58.1% of them Google's, and what they want is a nicer surface on top of it or one specific job done better.
Methodology
MethodologyEfficient App ran a free Software Stack Quiz at efficient.app that asked visitors about their business and goals before recommending tools. This report analyzes all 7,296 completed responses submitted between April 20, 2024 and May 31, 2026.
The respondents were overwhelmingly individuals and very small teams.
All 7,296 respondents were asked how big their team is. 7,293 answered.
Answer | Share | Respondents |
|---|---|---|
Individual (1) | 65.5% | 4,779 |
Very Small Team (2-5) | 22.9% | 1,668 |
Small Team (6-20) | 7.5% | 546 |
Mid-Size Team (20-50) | 2.1% | 155 |
Enterprise (200+) | 1.1% | 78 |
Large Team (50-200) | 0.9% | 67 |
All 7,296 respondents were asked what type of business they run. 4,421 selected one of the options below and a further 1,402 wrote in a type that was not listed.
Answer | Share of those selecting a listed type | Respondents |
|---|---|---|
Service-Based | 36.9% | 1,632 |
Agency/Consultancy | 31.5% | 1,393 |
Tech Startup | 15.5% | 687 |
Ecommerce | 6.0% | 266 |
Real Estate | 5.0% | 222 |
Manufacturing/B2B | 5.0% | 221 |
How respondents found us. All 7,296 respondents were asked how they heard about Efficient App. 7,286 answered.
Answer | Share | Respondents |
|---|---|---|
YouTube | 56.9% | 4,148 |
27.9% | 2,032 | |
AI Search (ChatGPT / Perplexity) | 3.6% | 260 |
Other (written in) | 3.5% | 257 |
Friend | 2.6% | 193 |
1.8% | 130 | |
TikTok | 1.5% | 110 |
1.1% | 80 | |
X | 1.0% | 76 |
What is included: Completed responses only. Partial responses were excluded entirely. Every table states the population, the exact question, and the number of people who answered it. Answer options appear exactly as respondents saw them. Questions allowing multiple answers are flagged where they appear.
Who these respondents are: This is a self-selected sample of people actively shopping for business software who found Efficient App, primarily through YouTube and search. It is not a representative sample of all businesses. It is a picture of the intent-driven buyer who is mid-decision, a group that is otherwise hard to survey precisely because they are in the middle of a purchase rather than at the start or the end of one.
Why we report totals rather than trends: The quiz ran for just over two years and we have deliberately not published year over year comparisons. Our respondents arrive through our own content, so any change in what we published changes the mix of who takes the quiz, which makes apparent movement over time unreliable as a signal about the wider market.
Why the data ends on May 31, 2026: The quiz was taken off the website in mid-2026 pending re-design.
Sample sizes: Category sizes range from 2,138 people choosing daily planners down to 72 choosing expense management. We report every category in full rather than dropping the smaller ones, and we show the respondent count alongside every percentage so readers can weigh each figure themselves.
How we tested differences: Where this report says a difference is significant, that means a chi-square test of independence returned the stated p-value. Where a comparison showed no meaningful relationship, we say so and give the p-value rather than omitting the result.
Cite This Data
Cite This DataYou are free to cite, quote and republish individual statistics in this report, including in commercial publications, with attribution to Efficient App and a link to this page.
Suggested citation:
Efficient App, "The Software Selection Report 2026: What 7,296 Professionals Actually Want From Business Software," 2026.
https://efficient.app/blog/software-selection-report
Source line for short citations: Efficient App Software Selection Report, 2026. Based on 7,296 responses collected between April 2024 and May 2026.
For interviews, additional cuts of the data, or methodology questions, contact: press@efficient.app